


You are looking at the documentation of a prior release. To read the documentation of the latest release, please
visit here.
Monitoring KubeStash with builtin Prometheus
This tutorial will show you how to configure builtin Prometheus scraper to monitor KubeStash.
To keep Prometheus resources isolated, we are going to use a separate namespace called monitoring to deploy the Prometheus server and its respective resources. Create the namespace as below if you haven’t done already.
$ kubectl create ns monitoring
namespace/monitoring created
Enable Monitoring in KubeStash
During the installation of KubeStash, all the necessary MetricsConfigurations are created. You can find these MetricsConfigurations using the following command:
$ kubectl get metricsconfigurations
NAME                                         APIVERSION                       KIND                  AGE
kubestash-appscode-com-backupconfiguration   core.kubestash.com/v1alpha1      BackupConfiguration   113m
kubestash-appscode-com-backupsession         core.kubestash.com/v1alpha1      BackupSession         113m
kubestash-appscode-com-backupstorage         storage.kubestash.com/v1alpha1   BackupStorage         113m
kubestash-appscode-com-repository            storage.kubestash.com/v1alpha1   Repository            113m
kubestash-appscode-com-restoresession        core.kubestash.com/v1alpha1      RestoreSession        113m
kubestash-appscode-com-snapshot              storage.kubestash.com/v1alpha1   Snapshot              113m
Next, you need to install Panopticon. You can install Panopticon using the following commands:
$ helm repo add appscode https://charts.appscode.com/stable/
$ helm repo update

$ helm install panopticon appscode/panopticon -n kubeops \
    --create-namespace \
    --set monitoring.enabled=true \
    --set monitoring.agent=prometheus.io/builtin \
    --set-file license=/path/to/license-file.txt
Deploy Prometheus Server
In this section, we are going to configure & deploy a Prometheus server to scrape KubeStash metrics using the Panopticon Service. We are going to deploy the Prometheus server in monitoring namespace.
Create RBAC:
Now, let’s create the necessary RBAC stuffs for the Prometheus server,
$ kubectl apply -f https://github.com/stashed/docs/raw/v2025.2.10/docs/guides/monitoring/prom-builtin/examples/prom-rbac.yaml
clusterrole.rbac.authorization.k8s.io/prometheus created
serviceaccount/prometheus created
clusterrolebinding.rbac.authorization.k8s.io/prometheus created
Create ConfigMap:
Now, create a ConfigMap with the necessary scraping configuration. Let’s create the ConfigMap,
$ kubectl apply -f https://github.com/stashed/docs/raw/v2025.2.10/docs/guides/monitoring/prom-builtin/examples/prom-configmap.yaml
configmap/prometheus-config created
Deploy Prometheus:
Now, we are ready to deploy our Prometheus server. YAML for the Deployment that we are going to create is shown below.
apiVersion: apps/v1
kind: Deployment
metadata:
  name: prometheus
  namespace: monitoring
  labels:
    app: prometheus-demo
spec:
  replicas: 1
  selector:
    matchLabels:
      app: prometheus
  template:
    metadata:
      labels:
        app: prometheus
    spec:
      serviceAccountName: prometheus
      containers:
        - name: prometheus
          image: prom/prometheus:v2.28.1  #v2.47.2
          args:
            - "--config.file=/etc/prometheus/prometheus.yml"
            - "--storage.tsdb.path=/prometheus/"
          ports:
            - containerPort: 9090
          volumeMounts:
            - name: prometheus-config
              mountPath: /etc/prometheus/
            - name: prometheus-storage
              mountPath: /prometheus/
      volumes:
        - name: prometheus-config
          configMap:
            defaultMode: 420
            name: prometheus-config
        - name: prometheus-storage
          emptyDir: {}
Let’s create the Deployment we have shown above,
$ kubectl apply -f https://github.com/stashed/docs/raw/v2025.2.10/docs/guides/monitoring/prom-builtin/examples/prom-deployment.yaml
deployment.apps/prometheus created
Now, wait for the Prometheus server to go into Running state,
$ kubectl get pods -n monitoring
NAME                                  READY   STATUS    RESTARTS   AGE
prometheus-9b97877-4vkpz              1/1     Running   0          16m
Once the Prometheus server Pod goes into the Running state, it should automatically discover the Panopticon endpoints using the configuration we have provided in the ConfigMap.
Verify Monitoring Metrics
Now, we are going to verify whether the Prometheus server has discovered the Panopticon endpoints or not. The Prometheus server we have deployed above is running on port 9090. We are going to use port forwarding to access the Prometheus web UI.
Run following command on a separate terminal to port-forward the Prometheus server Pod,
$ kubectl port-forward -n monitoring prometheus-9b97877-4vkpz 9090
Forwarding from 127.0.0.1:9090 -> 9090
Forwarding from [::1]:9090 -> 9090
Now, we can access the web UI at localhost:9090. Open http://localhost:9090/targets in your browser. You should see Panopticon service as targets.
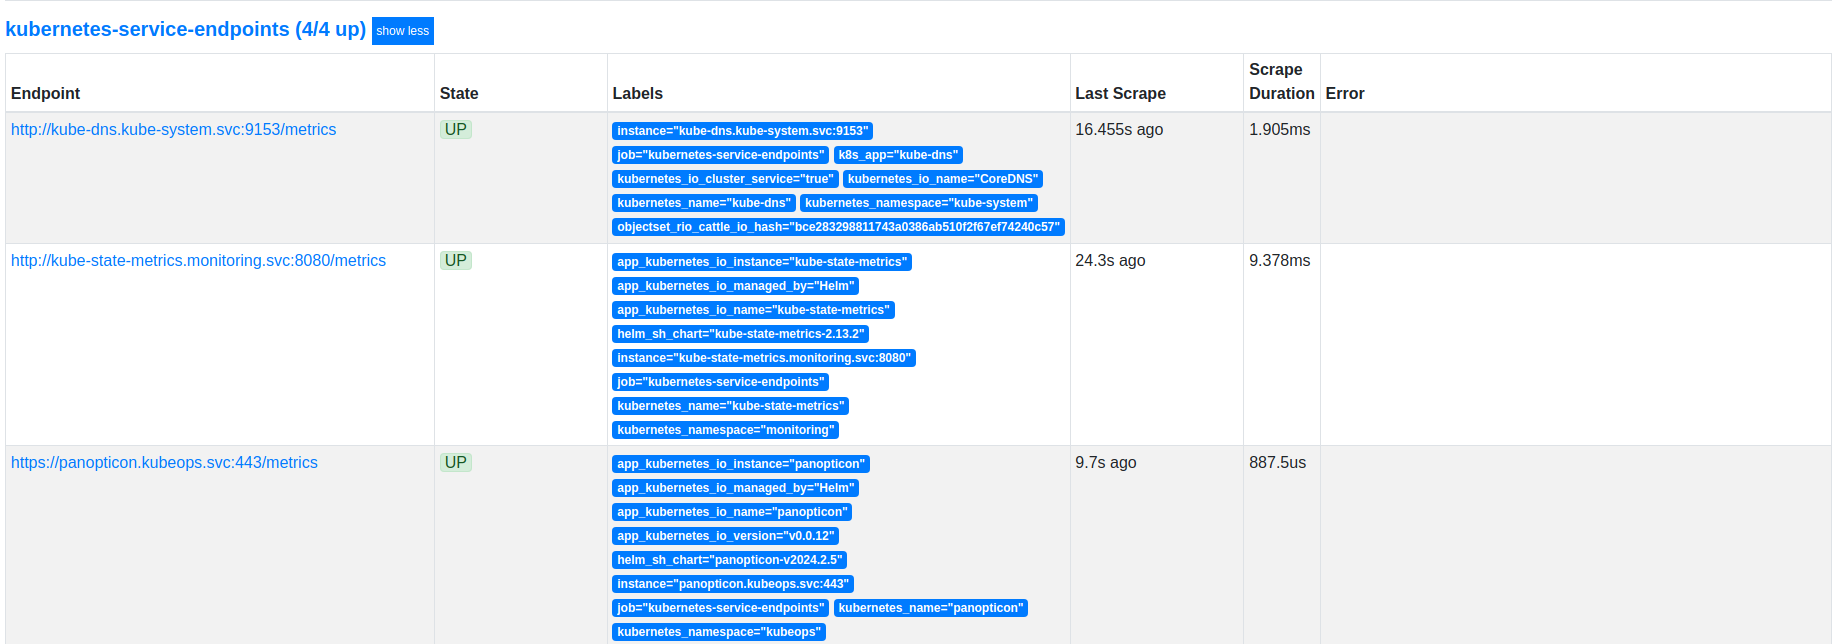
As you can see from the above image that the Prometheus server has successfully discovered the Panopticon endpoints. Now, if you perform backup and restore operations, you should see the respective metrics have been scrapped by the Prometheus server.
Cleanup
To cleanup the Kubernetes resources created by this tutorial, run:
kubectl delete clusterrole prometheus
kubectl delete clusterrolebinding prometheus

kubectl delete serviceaccount/prometheus -n monitoring
kubectl delete configmap/prometheus-config -n monitoring
kubectl delete deployment prometheus -n monitoring

kubectl delete ns monitoring
To uninstall KubeStash follow this guide.